The Power Pack

How can you accelerate your business adoption of Power BI? We've developed the Power Pack, a suite of pre-built reports right at your fingertips. And the best part about it? It's FREE if you're already a customer of ours!

Accelerate business
Power Pack - off the shelf 600x600

What is the Power Pack?

Our Power BI specialists have created a set of pre-built reports, ready for you to make use of right away within Dynamics 365 Business Central.

These Power BI reports are available off the shelf and include the following:

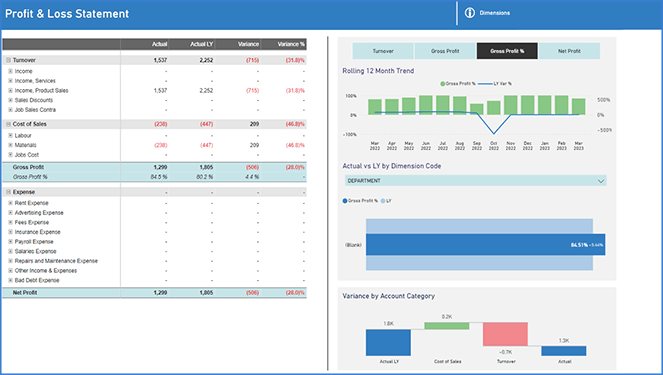
  • Finance: P&L, Balance Sheet and GL Detail
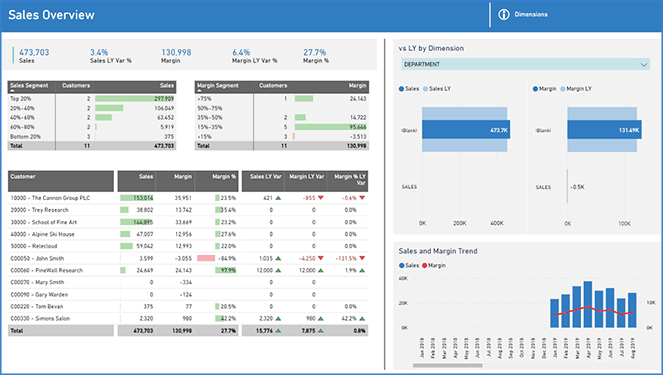
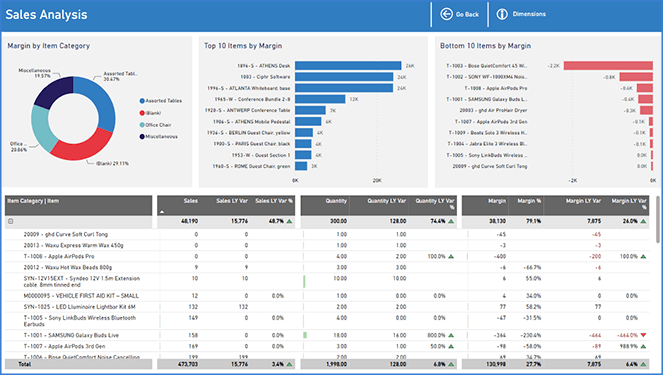
  • Sales: Customer segmentation, item sales and margin analysis
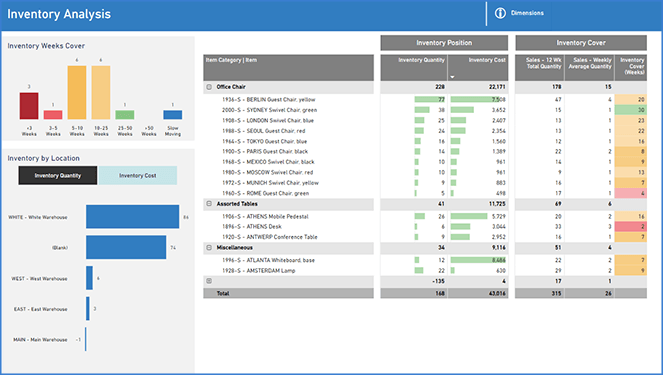
  • Inventory: Availability, ageing and cover
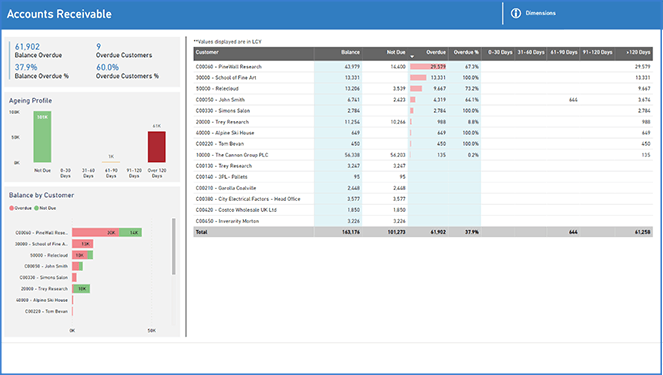
  • Credit Control: Accounts receivable and payable
Sign me up!
Out-of-the-box_2 600x600

Who is the Power Pack available for?

The Power Pack is available for Dynamics 365 Business Central Online (SaaS) out-of-the-box - all you need to do is install our extension. There are a few pre-requisite settings to check but these are simple.

If you're using Business Central On-Premise or an older version of Dynamics NAV or Navision (or any other system!), give us a call and we'll talk you through your options, as we can get you up and running quickly.

Get in touch
Carlos Cloud ERP 600x600

Why make use of the Power Pack?

The Power Pack is a fantastic way to get Power BI into your business and get your users actively using it! With our pre-built starter pack of reports, you will become familiar with utilising Power BI and seeing the benefits.

We developed this suite of reports based on the common use cases from our customers. Through these reports, we wanted you to experience our best practice approach to intelligently designed analytical views which directly support decision making.

By design, they are a starter pack of reports. As your requirements grow, we will work with you to develop more sophisticated solutions. 

Get the Power Pack today and kickstart the adoption of Power BI within your business. Evolve your sophistication of use and see greater visibility across departments and functions.

See more of what you'll get

What's included in the Power Pack?

Out-of-the-box, you get the following reports:

  • Finance Report

    The purpose of this report is to provide a dynamic approach to an otherwise traditional set of financial statements. The user can review P&L and Balance Sheet for current and prior periods, analyse trend and asses the financial results of the company across dimensions. Once a result has been identified for further investigation, the user can drill through to GL entries to analyse the lowest level of detail, showcasing the ability of Power BI to deliver high-level KPI results, alongside the ability to provide the lowest level of detail in support of that analyse and to complete the self-service of insight.

  • Sales Report

    The purpose of this report is to provide users with the ability to quickly identify the largest and smallest customers of the business in any period, by Turnover, and to identify those customers with high and low gross profit margins. This approach showcases how Power BI can be used to transform a detailed dataset into a decision-focused dashboard; unprofitable customers can be isolated with two clicks, and then the user can drill through to analyse those sales across items, to identify pricing problems and isolate the actions required. This version of the sales report is built to analyse sales of inventory.

  • Inventory Report

    The purpose of this report is to provide users with the ability to quickly identify the current status of inventory cover across all items by location. The report is augmented by the last 12 weeks of sales data to calculate how many weeks’ worth of sales of each item are currently held, thus allowing us to visualise each item by a banding of weeks-cover. A user can analyse inventory on this basis and identify items at risk of being out of stock (therefore putting order fulfilment at risk), alongside those items which are slow moving, to affect inventory management decisions in the business.

  • Accounts Receivable Report

    The purpose of the Accounts Receivable report is to provide the ability to easily identify problematic customer balances, by exception, and to be able to drill down to the appropriate level of detail to understand individual invoices outstanding. This action-focused approach is intended to support decision-making for communicating with customers and targeting activities towards the largest, most overdue, or riskiest balances to support healthy cash flow in the business.

  • Accounts Payable Report

    The purpose of the Accounts Payable report is to provide users with the ability to easily identify problematic vendor balances, focusing on exceptions, and enabling drill-down to understand individual outstanding invoices in detail. This action-oriented approach aims to support decision-making by facilitating effective communication with vendors. The goal is to optimise cash flow within the business by actively managing accounts payable and fostering strong vendor relationships, to ensure a healthy supply chain, while sensibly utilising credit terms for healthy working capital. 

person-holding-light-bulb

Did you know...?

We are proud to offer a variety of data analytics services and solutions, not only Microsoft Power BI.

We appreciate how valuable it is to your business to be able to get access to the information you need in a dynamic, automated way. This technology allows you to make better decisions.

To drive this, we offer a range of services, including Power BI and the Power Pack, to help you to achieve this.

Our services include:

  • Strategic data reviews
  • Data warehousing - including enterprise-level, multi-system requirements
  • Bespoke reporting and analytics through Power BI
  • Predictive analytics through Azure, Power BI and Microsoft Fabric
Talk to us about our services
Got any questions about the Power Pack? Get in touch!

Register your interest in the Power Pack

Go back to the Power BI page